
Few weeks ago I was working on simple AVR PWM channel driven switch mode power supply that involved measurement of true-RMS current. Measured signal was steady and periodical with frequency around 40 kHz but it had very funky shape. At first I though about using some analog true-rms detector IC but than I said myself why not to use AVR ADC to sample the waveform directly? Although it has sampling rate limited to 15 kS/s for maximum resolution, its analog bandwidth is probably much higher because it contains no antialiasing filter. Normally, in real-time sampling mode, this ADC would be able to capture my waveform only with frequency less than some 500 Hz with reasonable time resolution for true-rms calculation. But fortunately there are several techniques how to sample signal with frequency components above Nyquist frequency. These techniques are often called Equivalent Time Sampling mode (ETS). Following text describes implementation of ETS with AVR ADC and measurement of its actual analog bandwidth which is not specified by ATMEL.
As mentioned the ETS is sampling technique that allows sampling of repetitive waveforms with frequency components above Nyquist frequency (fs/2).
It was very popular in older Digital Storage Oscilloscopes (DSO) because fast ADC's were very expensive back than.
Today it's mostly used only in toys like PicoScope and similars or in very fast DSO's where realtime sampling is simply impossible. Interesting fact is that
these methods are at least partially applicable for analog scopes too (sampling oscilloscopes).
There are several techniques: sequential, random sampling and their different realizations. I won't describe all of them because internet is full of such articles.
For my purposes I used the simplest possible method which is sequential sampling but unlike in many DSO's it involves no synchronization.
The idea is based on simple principle: If I set sampling rate to certain exactly defined ratio with fundamental frequency of my periodical waveform I get
alias of the waveform with certain time scale and order of samples. Example of such case is shown in fig. 1.1.
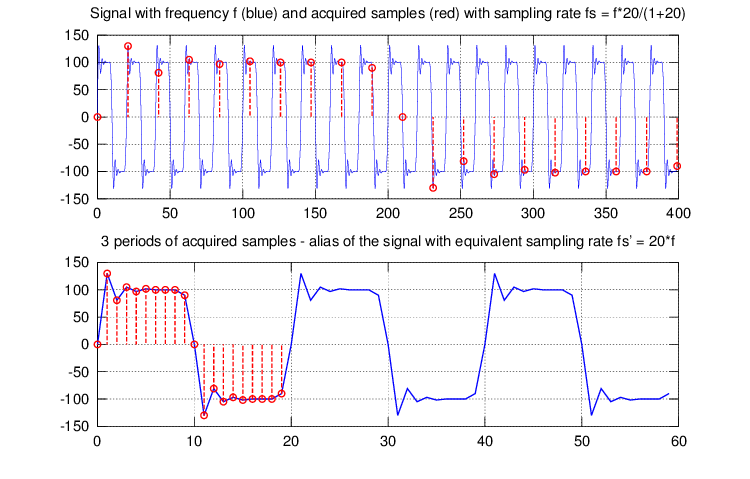 Fig. 1.1 - Equivalent Time Sampling example.
|
Upper graph shows original waveform with fund. frequency f and the sampling intervals. The sampling rate fs is set exactly with ratio r = 20/(1+20) relative to f so every
new acquired sample is delayed by 1/20 of waveform period T more then the former one. After 20 samples the sample delay relative to the waveform period start is again exactly zero so I have one full period acquired.
The lower graph shows several periods composed of the acquired samples. The reconstructed signal has time magnification of 20 and equivalent sampling
rate (20+1) times higher than realtime sampling rate fs. In this particular case the ratio r was chosen so the samples comes already in order so it's not even necessary to reorder them. This ratio
also ensures that I have integer count of samples per period of the waveform so I don't even need synchronization because the alias will be static if it is captured continuously.
This was of course ideal situation when there is full control over both frequencies so any ratio can be set and is fully stable in time. This is possible only in case when both signals are generated from the same clock source which is
for example the case of my switch mode PSU where the current waveform frequency is generated by AVR PWM channel timer.
In real world situations it is a bit more complex because
the sampled waveform usually comes from independent source so to do this it is necessary to measure fund. frequency of the waveform (for example from level trigger pulses). Then it is necessary to be able
to generate exact sampling rate and this is not as easy as it looks like because timers or PLL's have limited frequency resolution. Therefore it is not possible to
easily achieve needed sampling rate and the alias will have incorrect scale or even the samples will come in different order than needed. Although it can be solved
by well filtered DDS generator the time resolution will be limited by such clock generator jitter (edge phase noise).
Fortunately it is possible to use different approach. Instead of trying to set exact ratio some of possible sampling rates is chosen and
actual ratio r is then calculated. With this ratio known it is very easy to find out which sample has what delay within the waveform period. As an example lets have the ratio 1/r = 2.71.
It means than every following sample is delayed by 2 full cycles and 0.71*T relative to the current one.
So by integrating the 1/r it is possible to find relative position of every acquired sample within waveform period. Example is shown in tab. 1.1.
| sample | relative sample time | relative sample position |
|---|---|---|
| 0 | 0.00*T | 0.00*T |
| 1 | 2.71*T | 0.71*T |
| 2 | 5.42*T | 0.42*T |
| 3 | 8.13*T | 0.13*T |
| 4 | 10.84*T | 0.84*T |
| 5 | 13.55*T | 0.55*T |
| 6 | 16.26*T | 0.26*T |
| 7 | 18.97*T | 0.97*T |
| ... | ... | ... |
Tab. 1.1 - Sample position calculation for the reordering process. |
The last column in tab. 1.1 shows the position of the sample within waveform period. If reasonable ratio is chosen and enough samples are acquired this parameter can be used to reorder the samples within the reconstructed period. In case improper ratio is chosen (or it's not possible to set it) or small samples count is available then there might be "holes" in the reconstructed period for higher time magnifications and it will be necessary to use interpolation. Realization of this method is shown in fig. 1.2.
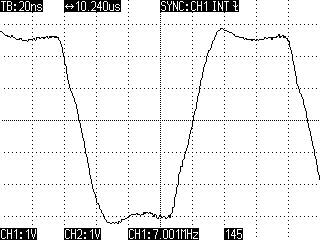 Fig. 1.2 - Equivalent Time Sampling example in real world - experimental DSO.
|
The waveform shown in the picture is export from my older experimental DSO. The realtime sampling rate is only 32 MS/s, sample memory depth is only 4 kS but even though it was possible to reconstruct the waveform with equivalent sampling rate 1.6 GS/s (which is 50x time magnification) and only few samples are missing (the steps in the waveform) so no interpolation was used. On the other hand the hardware wasn't designed for this mode of sampling so I have almost no control over sampling rate, only discrete steps 1-2-5 which is useless here. Result is that some signals with frequency close to some fractions of sampling rate can't be reconstructed as shown in fig 1.3.
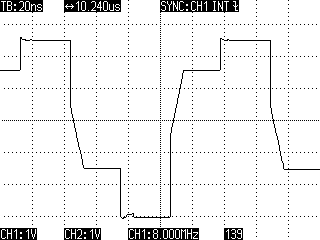 Fig. 1.3 - Equivalent Time Sampling example in real world - experimental DSO, bad freq. ratio.
|
Even if the ratio r wasn't exactly x.0000 the fractional part was too close to 0 so the 4 kS/s weren't enough to get samples with all needed delays to reconstruct full period. This is exactly the case where interpolation can help but it of course only smoothes the waveform without any details.
Fortunately in case of my AVR based switch mode PSU I have full control over the ratio. Although the 16-bit timer
offers only limited frequency resolution it is enough for the application and for some timer periods static aliases with integer sample count appears.
Sometimes simple reordering is needed but it is necessary only for displaying the waveform because true-rms calculation is not dependent on order of the samples. It is
only important to have as many evenly displaced samples as possible within the waveform period. To find possible ratios I've made a simple script for Matlab/GNU Octave (link below).
In the script it is necessary to setup AVR clock frequency, ADC setup (defaultly free-running mode) and desired range of
timer output frequencies. The script then scans all possible timer OCR register setups and displays values that will produce alias with integer sample count per waveform period.
Detailed description can be found in the script itself.
GNU Octave script for AVR timer setup for ETS: Octave_AVR_ets.zip (10 kB).
With debugged ETS I decided to measure actual ADC analog bandwidth. ATMEL claims 38.5 kHz in the datasheet but that looks like Nyquist frequency for highest ADC clock and that has of course nothing to do with analog bandwidth. Analog bandwidth is defined by three main parameters:
- Serial input impedance Z (combined external and internal).
- Capacity of the hold capacitor Ch.
- S&H sampling interval tsh.
In another section of the datasheet there is simplified internal diagram of ADC input and Sample&Hold circuit. Capacity Ch is around 14 pF.
Series resistance R is anything between 1 and 100 kOhms. In case it is true it means 3 dB amplitude attenuation anywhere in range:
f0 = 1/(2*pi*R*C) = 114 kHz to 11.4 MHz.
That is not very helpfull information at all. Parameter 3) is even more mysterious because from the graphs I can see where the sampling interval stops (1.5 ADC clocks after conversion start for free-running mode)
but it's not obvious where it starts. Assuming the sampling switch is closed for whole 1.5 cycles it means sampling interval longer than 7.5 us (for maximum ADC clock 200 kHz).
Preferably this interval should be at least several times longer then time constant R*Ch because then it becames irrelevant and the bandwidth is given only by the R and Ch.
If it is comparable or shorter than the R*Ch time constant it limits charging of the Ch capacitor and causes further decrease of the bandwidth. So in ETS mode I get higher bandwidth with slower ADC clock (longer S&H interval). :-)
To find actual bandwidth I decided to use following method: The ADC is feed with signal with known spectrum. The waveform on the ADC input pin is sampled by both AVR ADC and fast DSO with high impednace probe.
Frequency transfer is than calculated by means of amplitude spectrum comparison with DSO as a reference. To achieve reasonable accuracy I choosed rectangular waveform which contains a lot of harmonics to compare.
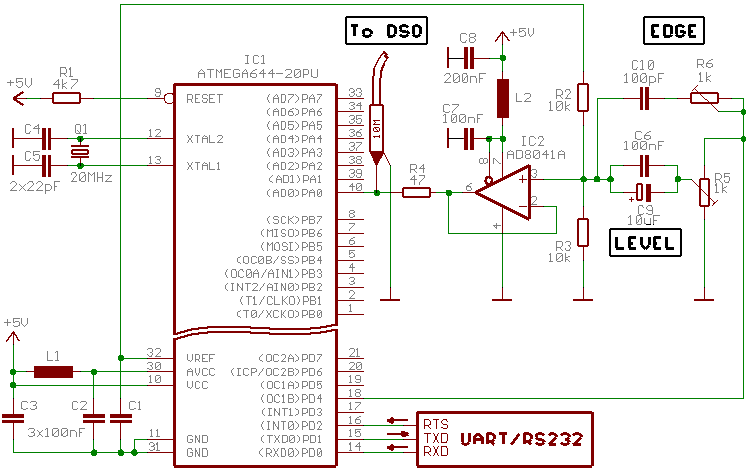 Fig. 2.1 - Circuit diagram for AVR ADC analog bandwidth measurement.
|
Circuit diagram for this experiment is shown in fig. 2.1. AVR generates rectangular waveform on PWM output OC1B. The signal
is then fed into rail-to-rail amplifier AD8041 via potentiometers for level control and slew rate contol. Output of the opamp is then connected via small
low-inductance resistor into ADC input ADC0 and high impedance DSO probe. The resistor is necessary because AD8041 is not able to drive the load directly without oscillations (around 30 MHz).
Communication with the PC is via UART with no parity and one stop bit.
I used FT232 virtual USB-COM port chip which wasn't able to handle the data flow from AVR so I had to add RTS line. Btw FT232 uses RTS to slow
down the data source even if HW handshake is disabled in Windoze communication APIs.
The firmware for AVR is very simple. It just sets registers for UART, timer and ADC and then samples+reorders waveform samples into round buffer.
Main loop is used for serial communication with PC. There is only one command 'W'. AVR responds with word with samples count N and then it sends N unsigned words of the waveform with values from 0 to 1023.
Program was made in AVR Studio 4.
AVR firmware and source codes download, 1.8.2013: ADC_bw_m644.zip (1.05 MB).
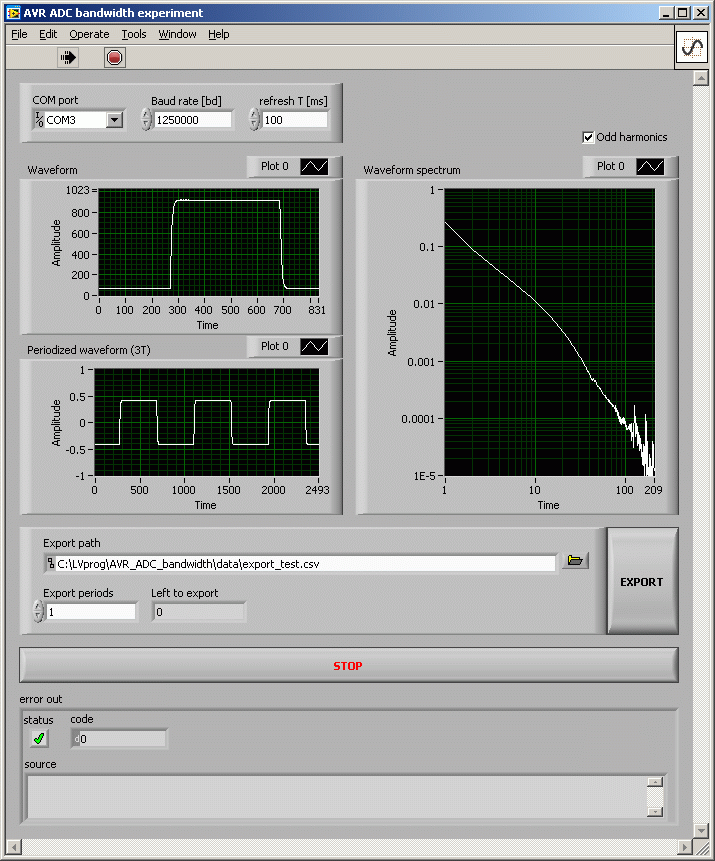 Fig. 2.2 - Simple realtime ADC waveform viewer in LabVIEW 2011, signal f = 24.0674 kHz, fs = 12.019 kS/s, fs' = 20 MS/s.
|
LabVIEW control program and "source codes" download, V1.00, 31.7.2013: AVR_ADC_bandwidth.zip (1.05 MB).
Fig. 2.2 shows screenshot of simple GUI for realtime displaying of the sampled waveform. The waveform in the figure has frequency around 24 kHz, realtime sampling
rate is set to 12.019 kS/s and ETS equivalent sampling freq is 20 MS/s (831 equivalent samples per waveform period). Right graph shows amplitudes of the odd harmonics of the waveform.
The program is made in LabVIEW 2011 so it requires NI's runtime engine and VISA drivers (at least version 2011). Both can be downloaded from
NI's webpage:
NI LabVIEW runtime engine 2012 download: http://joule.ni.com/nidu/cds/view/p/id/3433/lang/en,
NI LabVIEW VISA 5.3: http://joule.ni.com/nidu/cds/view/p/id/3823/lang/en.
The NI's runtime rubbish is "a bit" big to install but I was too lazy to draw the graphs in C/C++ by my self. The program tries to open COM port at certain baudrate and then periodically sends command for waveform readout. Received unsigned waveform is then converted to signed and normalized to ±1. Right graph shows amplitude spectrum of the signal. Unfortunately I don't have LabVIEW packages for signal analysis so I had to implement my own fourier transform. Although I used LV's matrix operations for the algorithm it is still a bit slow for higher sample counts. The program also allows export of waveform data into a csv file with selectable periods count.
Main calculation of the analog bandwidth is made by m-script for GNU Octave. Unfortunately I used function "leasqr()" for AVR vs DSO timebase deviation calculation
in the script so it won't work in Matlab. Simple description of the script: Loading reference (DSO) and AVR waveforms from CSV files,
preprocessing of the waveforms, correction of DSO timebase deviation from AVR, amplitude spectrums calculation, comparison of the spectrums => frequency transfer function.
I was also interested what is effect of the input waveforms and parameters uncertainties to the result so I also implemented simple measurement uncertainty analysis by means of Monte-Carlo method (MC).
It uses only few, mostly guessed, input uncertainties such as quantization noise, nonlinearity of the ADC and DSO input stage flatness.
MC unc. analysis is brute force method that requires at least 1000 or preferably 10000 iterations for reasonable results so I'm using
multicore processing to speed it up.
Unfortunately there is still no working "parcellfun()" implementation for Windoze so I'm using modified "multicore" package. This solution has one disadvantage:
it's distributing the jobs via files in shared folder and this is extremely slow in Windoze especially with large input parameters (long waveforms).
It means it would be necessary to duplicate approx. 8 MB of data into 10000 files.
Because of this I've made a simple script that groups the jobs (MC iterations) into larger chunks and processes them at once so passing of the parameters is reduced down to some 100 files.
This has reduced job distribution overhead to reasonable level. With 4 cores I reached 3.1x speedup including insane Octave process startup time (more than 30 seconds in last version).
The script was tested in GNU Octave 3.6.4 with packages "optim 1.2.2" and "multicore 0.2.15" (both in standard package set).
GNU Octave scripts for AVR ADC bandwidth measurement: Octave_AVR_ADC_bandwidth.zip (315 kB).
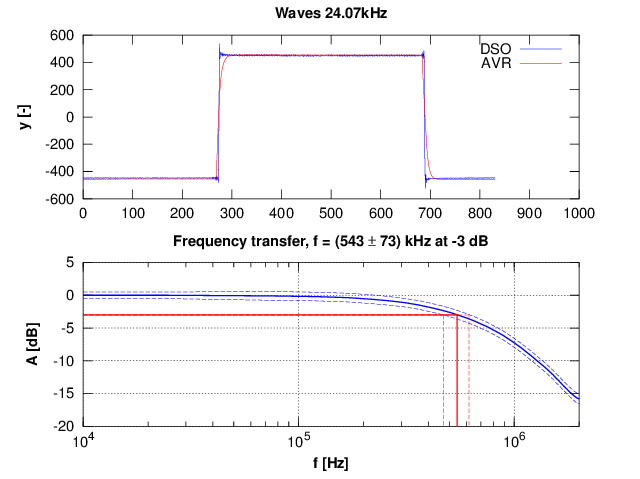 Fig. 2.3 - Measured AVR ADC bandwidth, signal f = 24.0674 kHz, fs = 12.019 kS/s, fs' = 20 MS/s, 831 samples per period.
|
Fig 2.3 shows result of the experiment. The reference signal was captured with low-end DSO Owon DS7102V with compensated Testec MF312 probe (250 MHz). Sample rate was 500 MS/s real-time. Although the DSO is really low-end its bandwidth is approx. 100 MHz so the flatness around 1 MHz should be good enough for the measurement. Measured bandwidth seems to be (543 ± 73) kHz for -3 dB. Distribution of the measurement uncertainty is shown in fig 2.4.
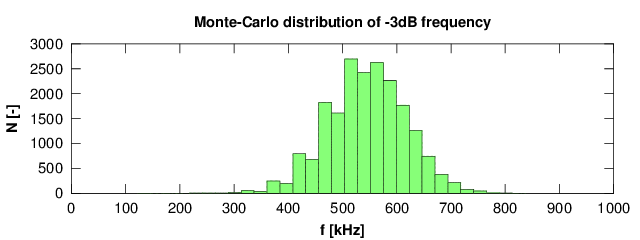 Fig. 2.4 - Measured AVR ADC bandwidth, distribution histogram of the meausurement uncertainty.
|
I repeated the experiment with different signal frequencies (both lower and higher) and slower ADC clocks but the results were almost identical (within uncertainty limits). So I assume the results are realistic. The waveform shape deformation compared to the DSO seems to be adequate to the bandwidth. So my conclusion is that AVR ADC is able do my measurement of the true-RMS value just fine for my signal.
| Last update: 5.8.2013 |  |
 |